Context
From a button nobody could see to 100% feature visibility
Wikipedia has almost 407M Gen Z readers. Wikimedia knew it had to change for them, but with a legacy platform comes a lot of constraints on how much you can innovate. And they wanted to experiment with AI.
There was no brief, just a vision: the Movement Strategy 2030, and two goals. Grow Gen Z readership, and bridge the gap between the people who read Wikipedia and the people who edit it.
Wikipedia is one of the only platforms bold enough to cover the most sensitive topics in a neutral, matter-of-fact voice. That is exactly what you need to form a perspective of your own. So we set out to make it more than a reading platform.
I owned the dig-deeper flow: the Timeline and Compiled Resources page. I also co-designed the split screen view.
Problem
How can we nudge Gen Z readers to explore every side of the story on Wikipedia?
What did the users want
We started by understanding how Gen Z consumes information and engages with it
We did 4 months of research with 50+ Gen Z readers around the world, through co-design workshops and interviews. The first thing we asked people to do was map their learning journey: how they learned growing up, and how they go about learning a new topic.
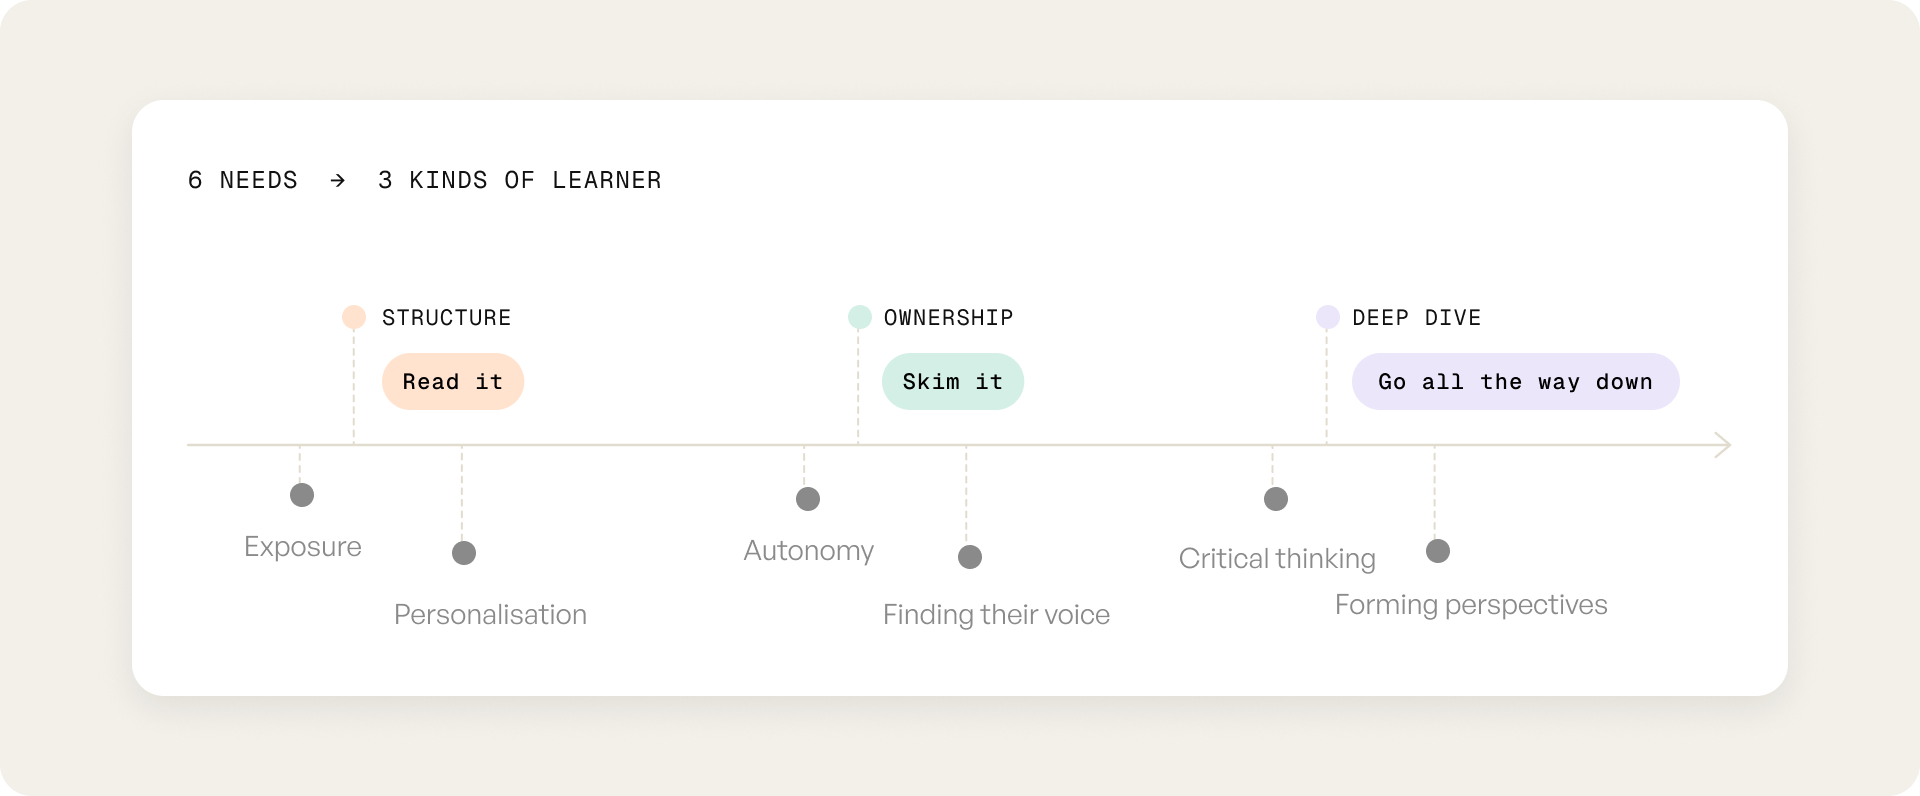
No two journeys looked the same. Some people want structure, some want ownership, some want a deep dive. So we didn't design one path. We designed three.
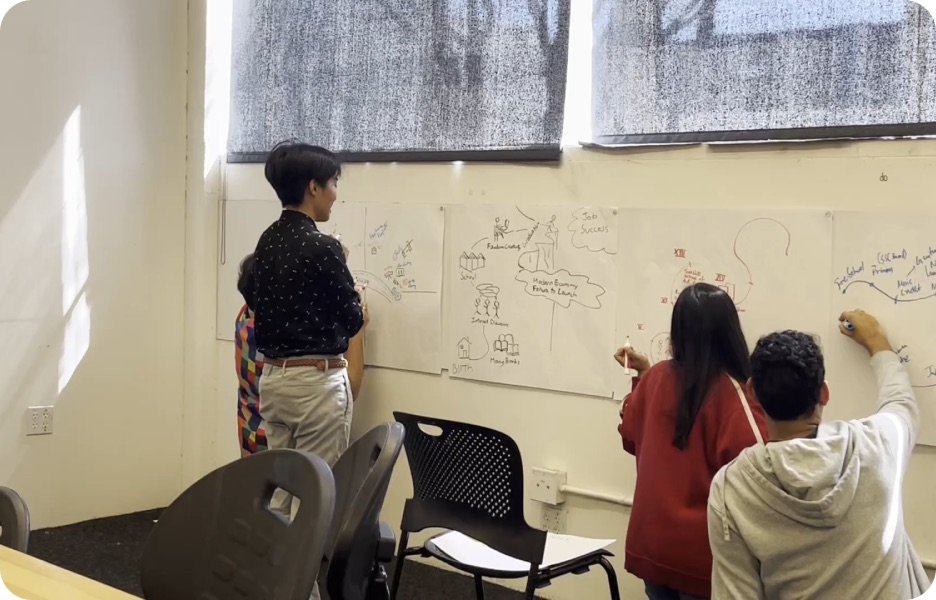
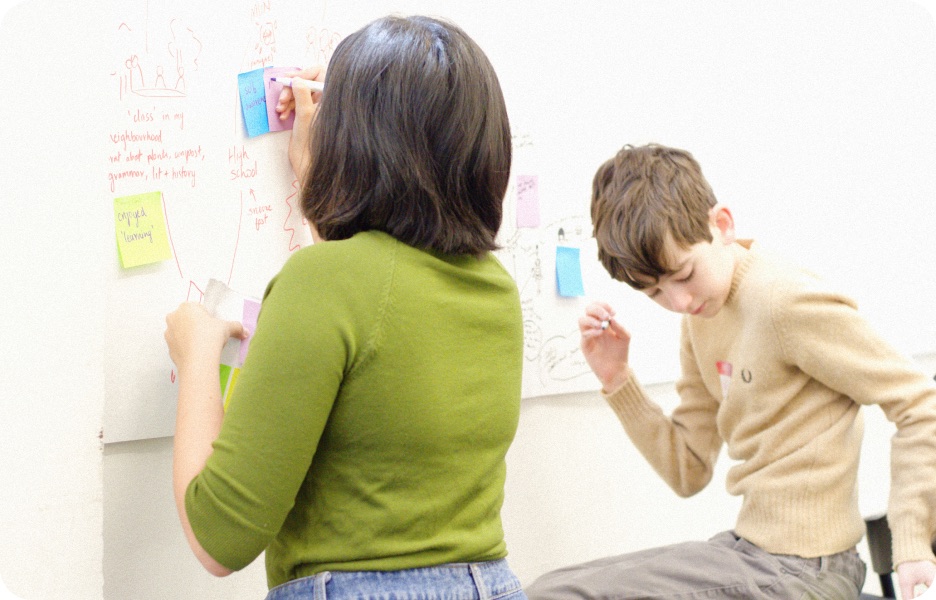
Before this, we explored a tool where people build their own learning modules. We killed it because it was turning into an ed-tech product, and something like it already existed in the Wikimedia universe.
Insights to product
So we didn’t design one path. We designed three.
Connect the dots helps users navigate related Wikipedia content, making it easier to understand complex information and form a well rounded view point.
Pivot #1
Readers couldn't find it, engineering couldn't build it
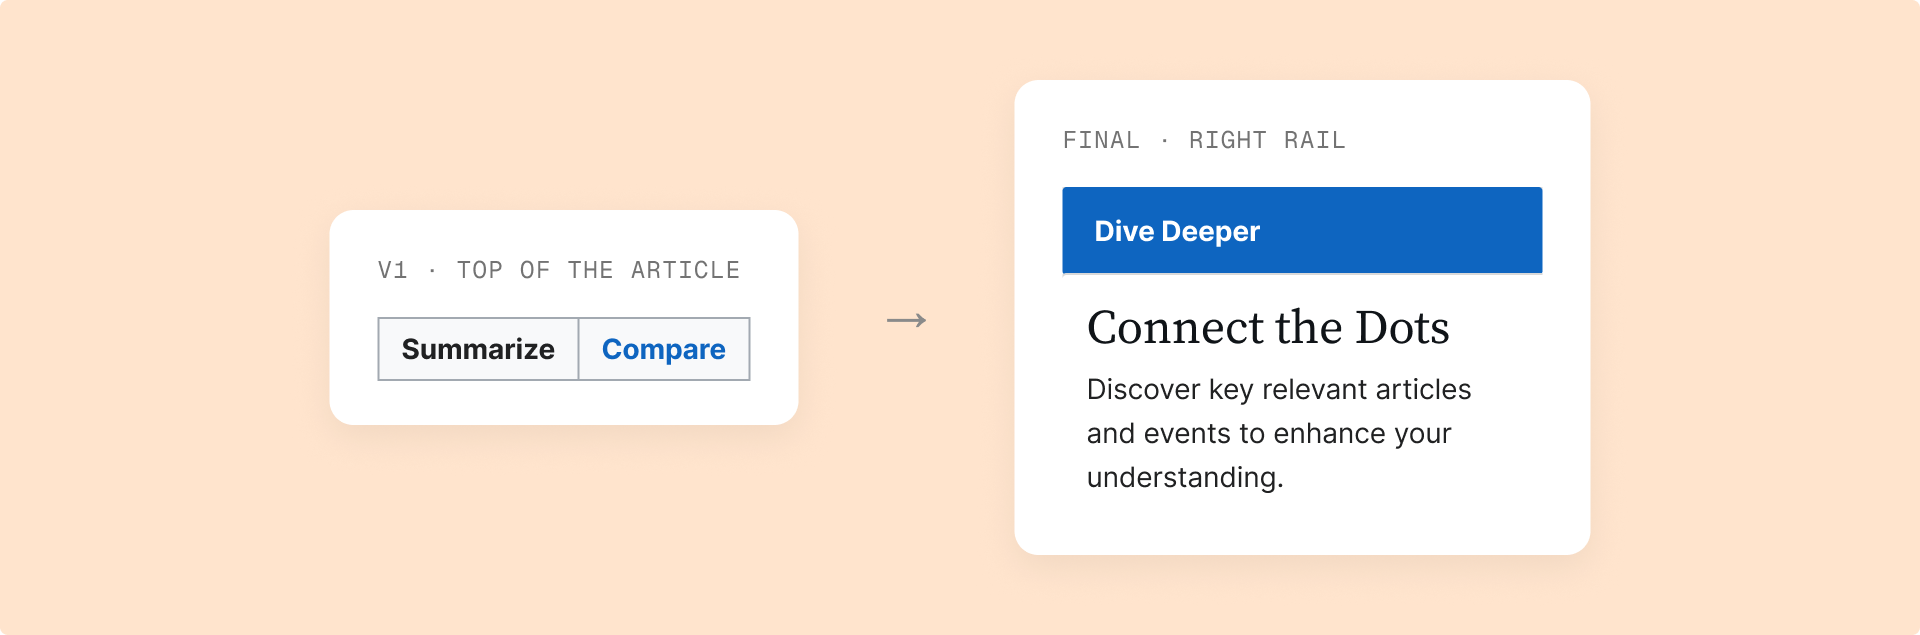
Our first version tried to do everything. A Compare button up top, a summary of the article, and a page where you could view information as a timeline, roadmap, table, graph or chart.
We were trying to simplify things, and we were making them more complicated.
When we tested it, the worst thing possible happened. Users couldn't discover the feature, or even understand what it was about. The flow felt too long because we were trying so hard to give them autonomy. And engineering told us the top of the page couldn't take anything new. It wasn't feasible at all.
A total moment of crisis.
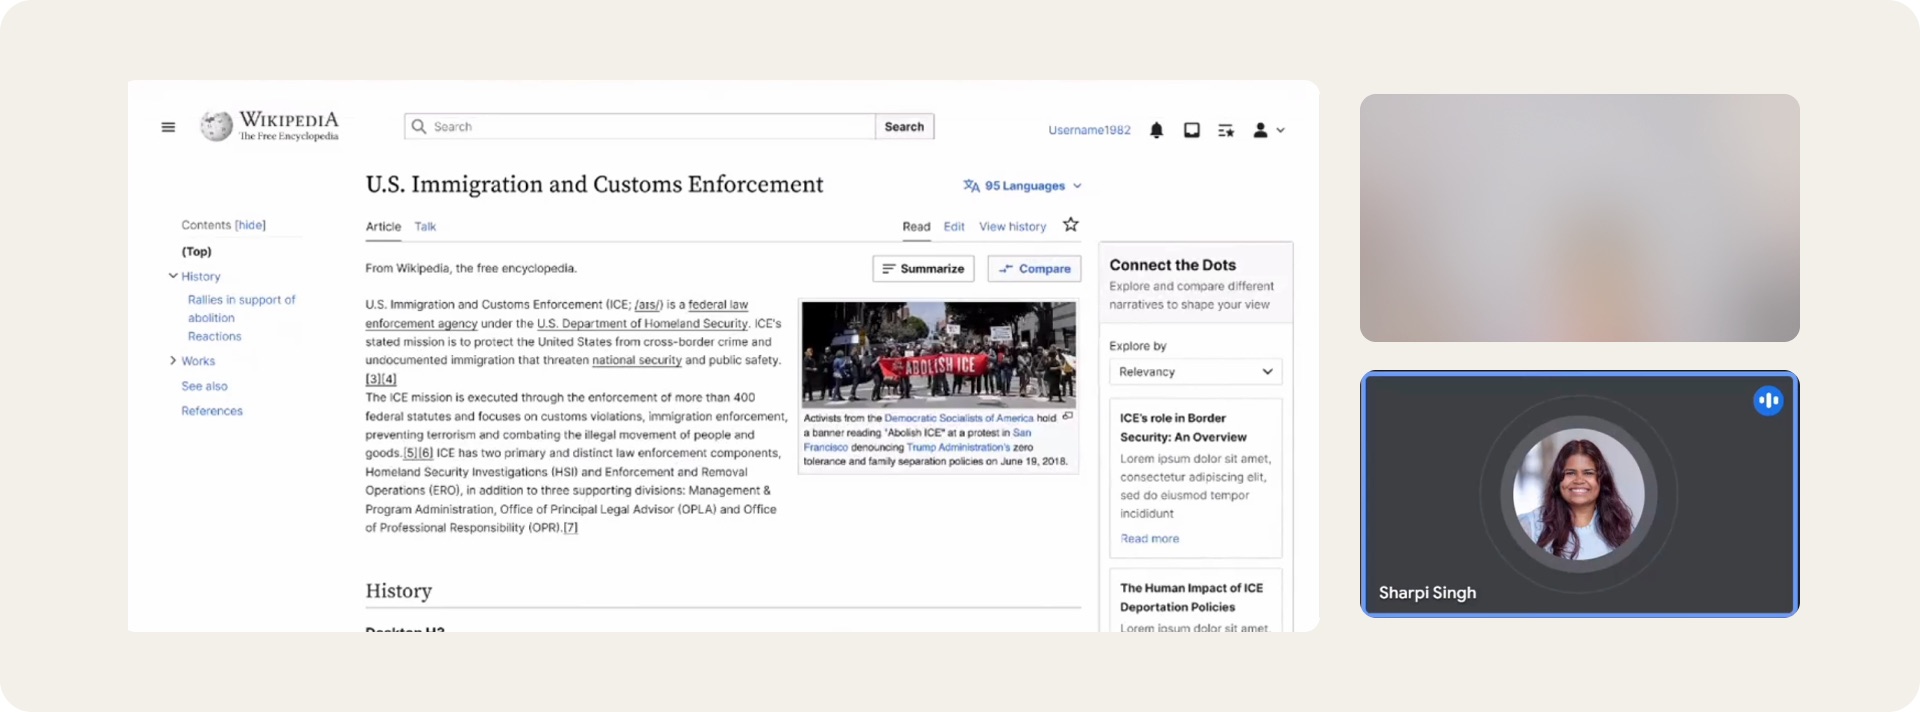
The only real estate left was the right side of the article. Moving our CTA there solved the technical problem, and the visibility problem too.
Pivot #2
We weren't comparing anything
Then a content design SME changed everything. Our main button was called Compare. But we weren't comparing anything. That was just in our heads. The CTA had to be neutral and still make you want to click.
Solution #1
Article → Split screen
Concept and feature testing shaped this flow. The CTA lives in the right rail. Engineering could build it there, and readers could see it. The split screen shows 3 articles at a glance. That’s the minimum number of sides you need to form a perspective. Every piece links to its source and is labelled as AI-generated.
Solution #2
Split screen → Timeline & compiled resources
This is for folks who want to dig deeper and get more relevant information. The timeline shows the entire picture through history instead of 5 formats. The information is compiled into 5 categories to help the reader understand and engage with information from different lenses. The source articles are linked below.
Design decisions
Three sources, five categories, no sides taken
The categories were the hardest call. I landed on five.
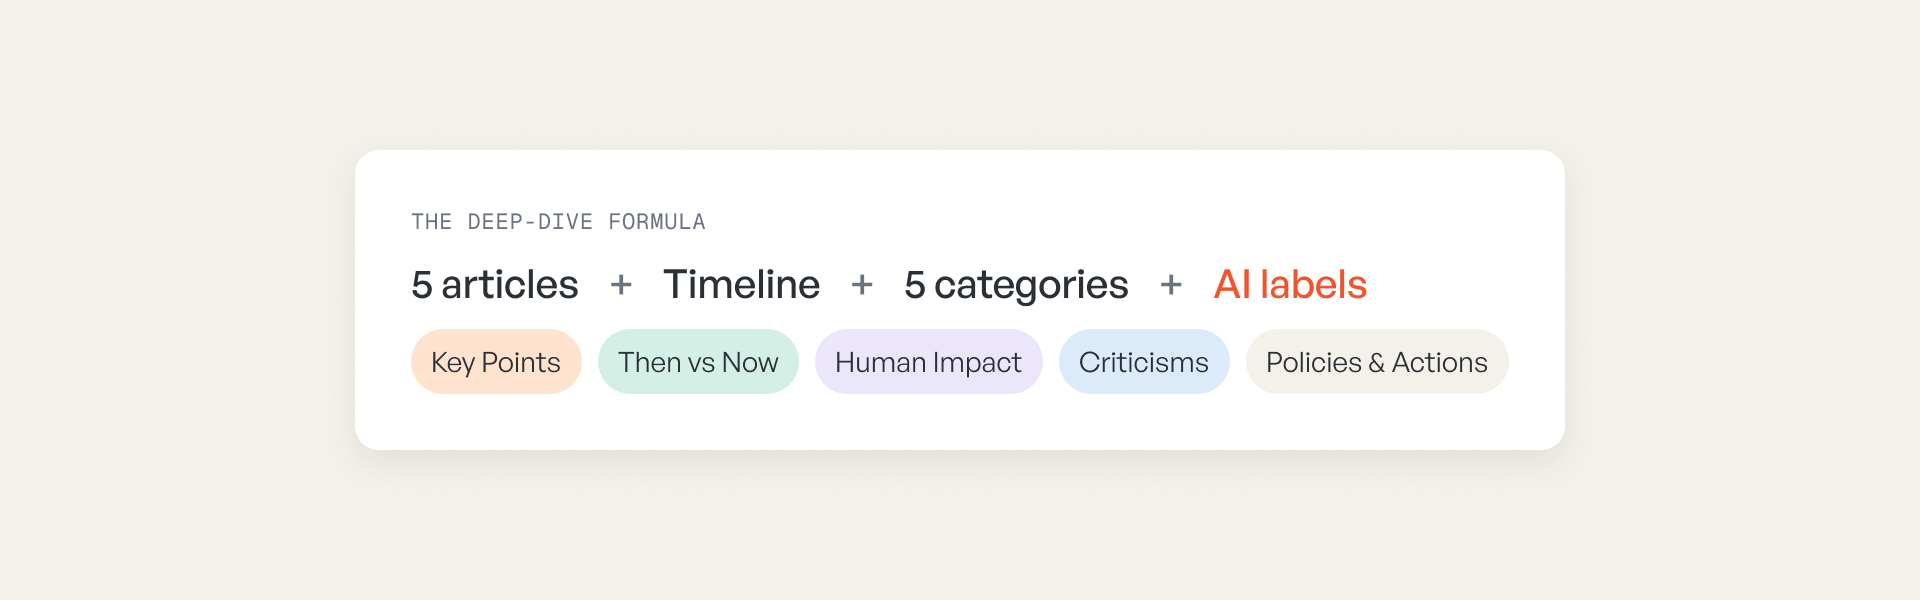
We wanted a mental health angle because Gen Z really cares about it. Our design manager asked how it fit. Fair. We dropped it. His bigger concern was that categories could make a topic polarised, which Wikipedia can never be. So Criticisms means real critiques, not gossip or conflict.
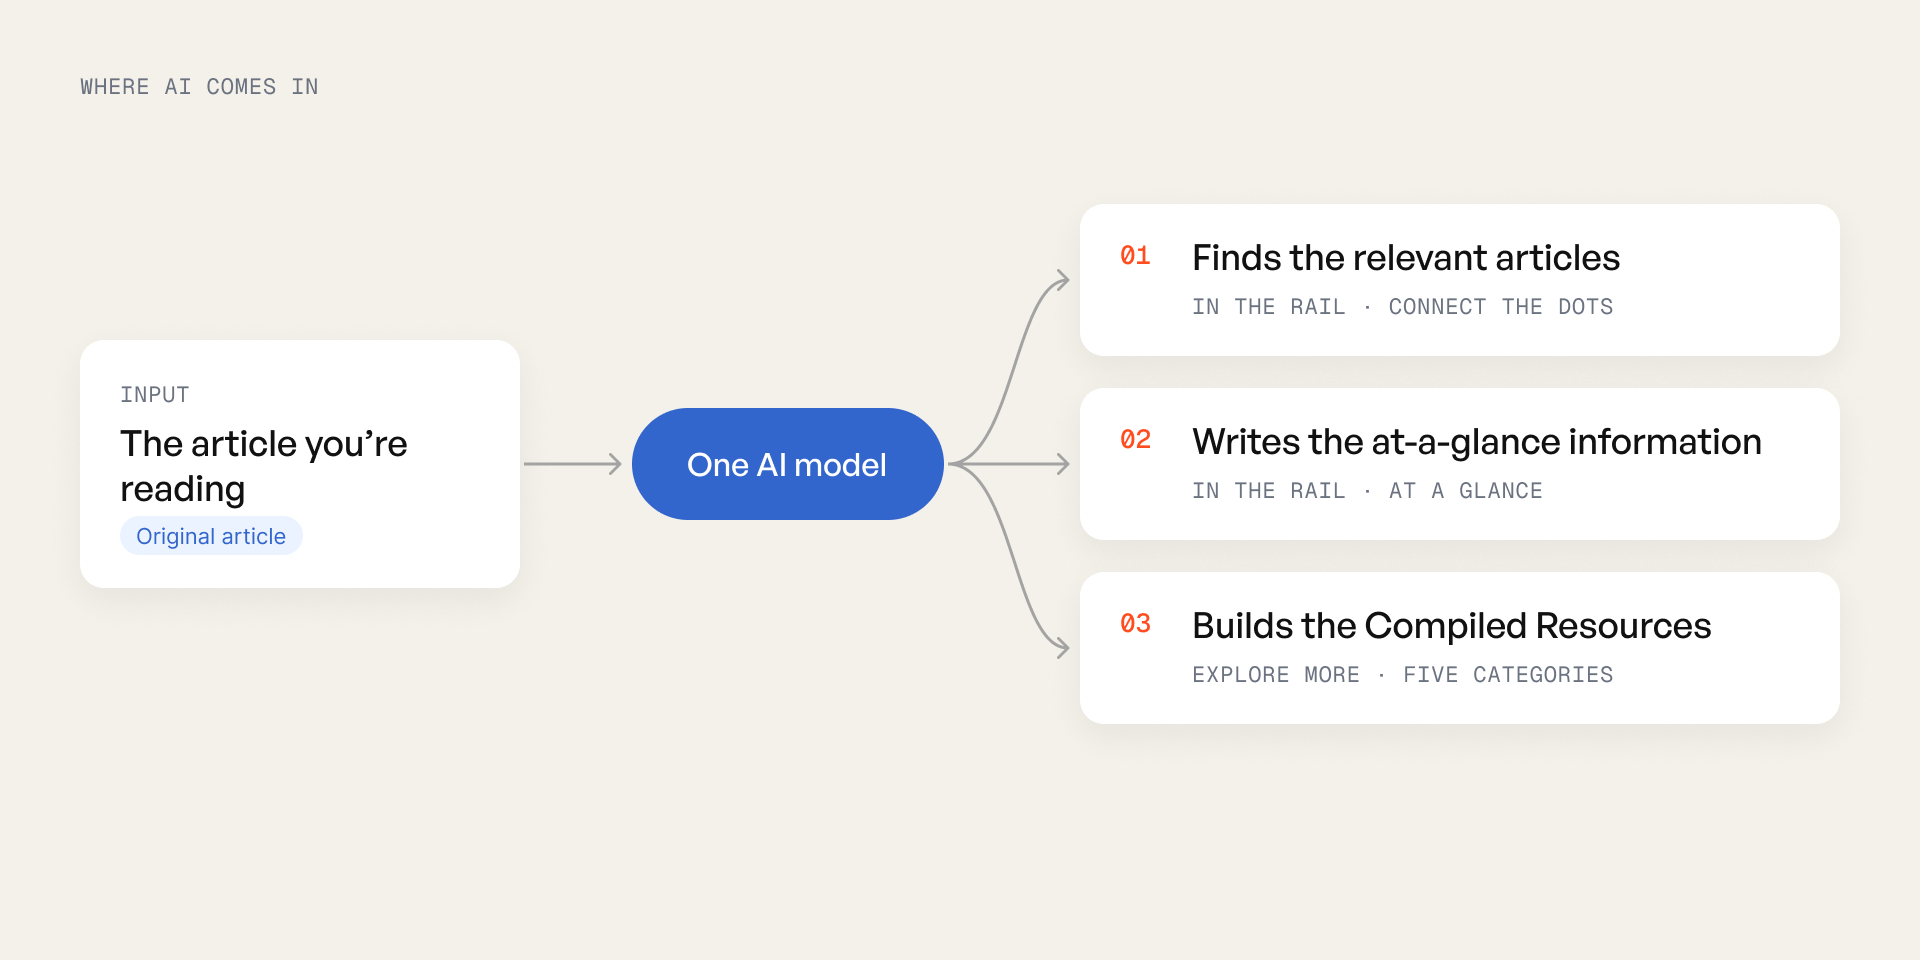
One AI model finds the relevant articles, writes the at-a-glance information and builds the Compiled Resources. So every AI-generated piece is labelled, with a note that it can make mistakes.
Iterations
Getting here was a journey
We got things wrong multiple times before we got them right from exploring modularizing information to simplifying the user flow
Reflections & learnings
Why it didn't ship
Stakeholders really liked it. But in 2024, Wikipedia wasn't ready for AI on its pages. Hallucination was a real risk back then. Two years later, models are far better. This is very buildable now, and I'd integrate AI even more.
- This project completely changed how I think about steps in a user flow.
- It completely changed how much weight I give to copy. One word nearly cost us the feature.
- It completely changed how I work. My core jobs to be done live on a sticky note I can always see, so I never solve a problem I didn't set out to solve.