Context
QMentis was live, and it saved time. But nobody could tell if it was working.
Before software ships, a QA team tests it: they write test cases, run them, and log every bug they find before users do. QualiZeal built QMentis AI to automate that work, with a person reviewing every output the AI makes.
The tool was already built, but there was a challenge nobody had picked up yet. The process was lean: an agile sprint where engineering built while I designed. There was no formal research, only secondary research.
The challenge
As QA work scaled through automation, visibility didn’t keep pace.
Leaders needed a way to see, trust and act on real-time work, without slowing teams down.
The user
I joined mid-build, after the first phase had shipped
The AI testing worked. People reviewed each output and accepted the good ones. But none of that reached the QA leaders, so they couldn’t see what QMentis was doing for them.
So I started in the ambiguity: I asked a lot of questions, talked to the team, and mapped who the user was and what they do every week.
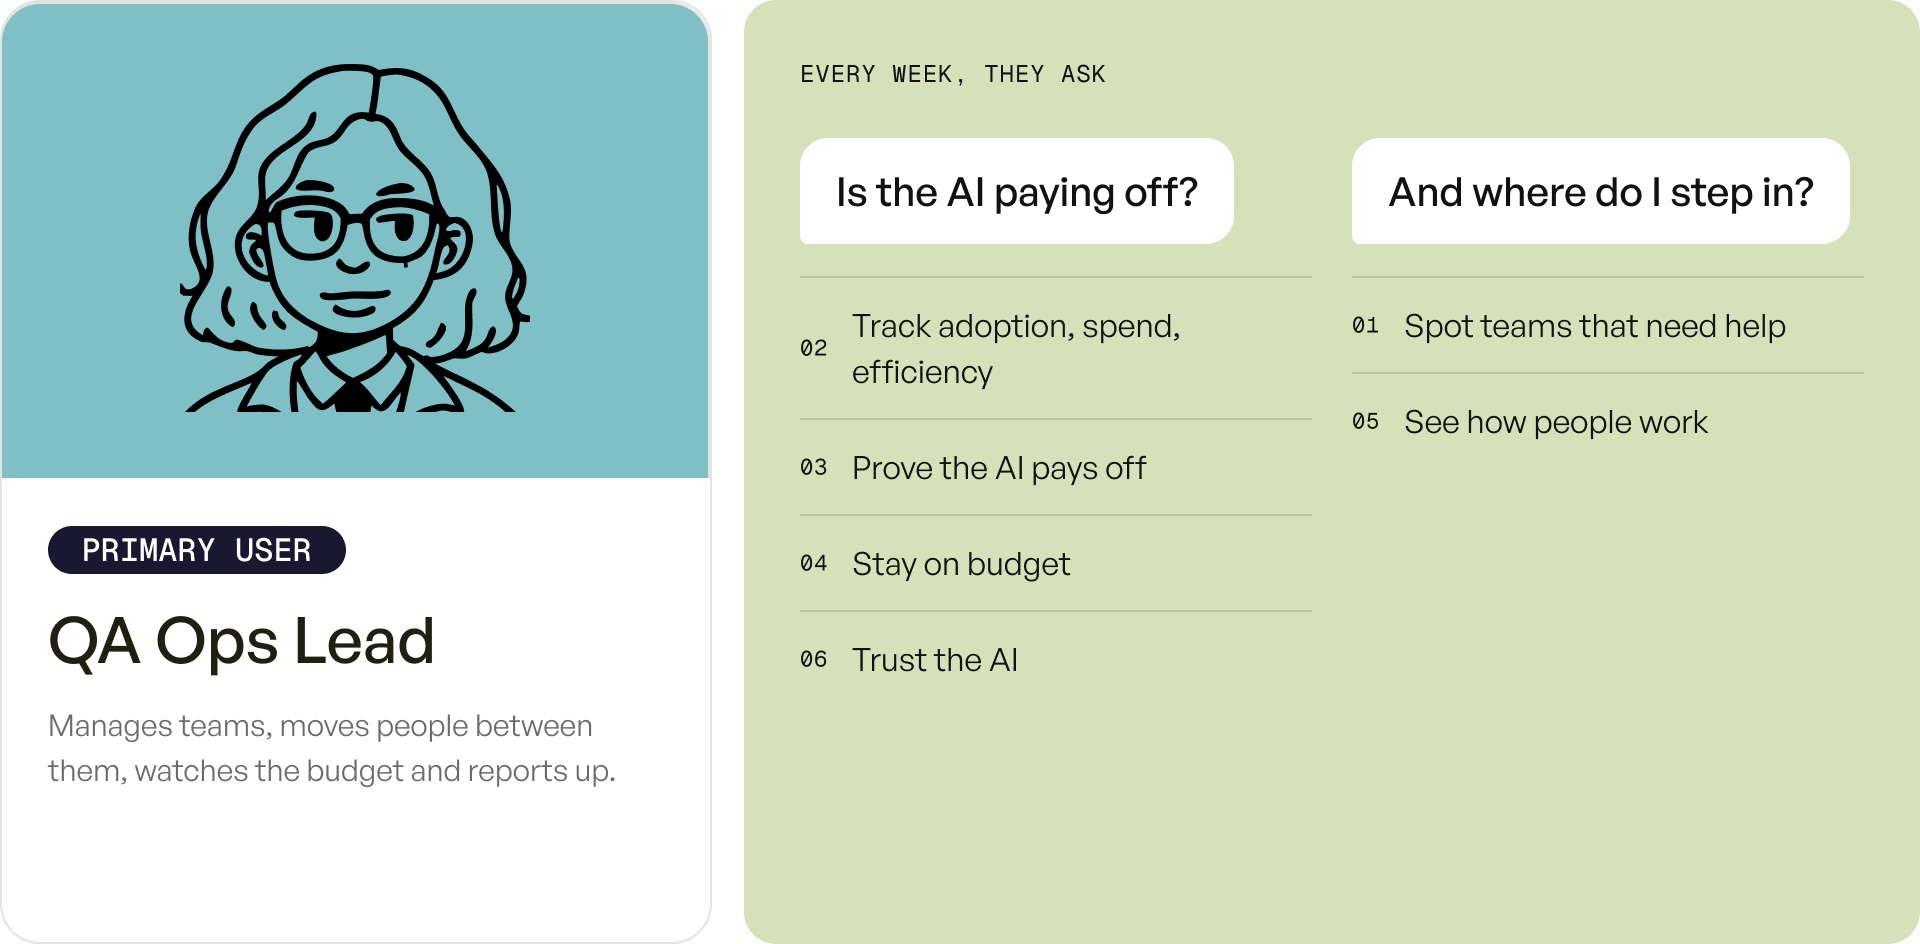
They had no ops tool to oversee every org, team and person in one place, or to tell leadership how much time the AI saved and whether it was a good investment. That became the brief: if a card didn’t do one of these jobs, it didn’t go on the dashboard.
Insights to design
The AI already knew what good work looked like
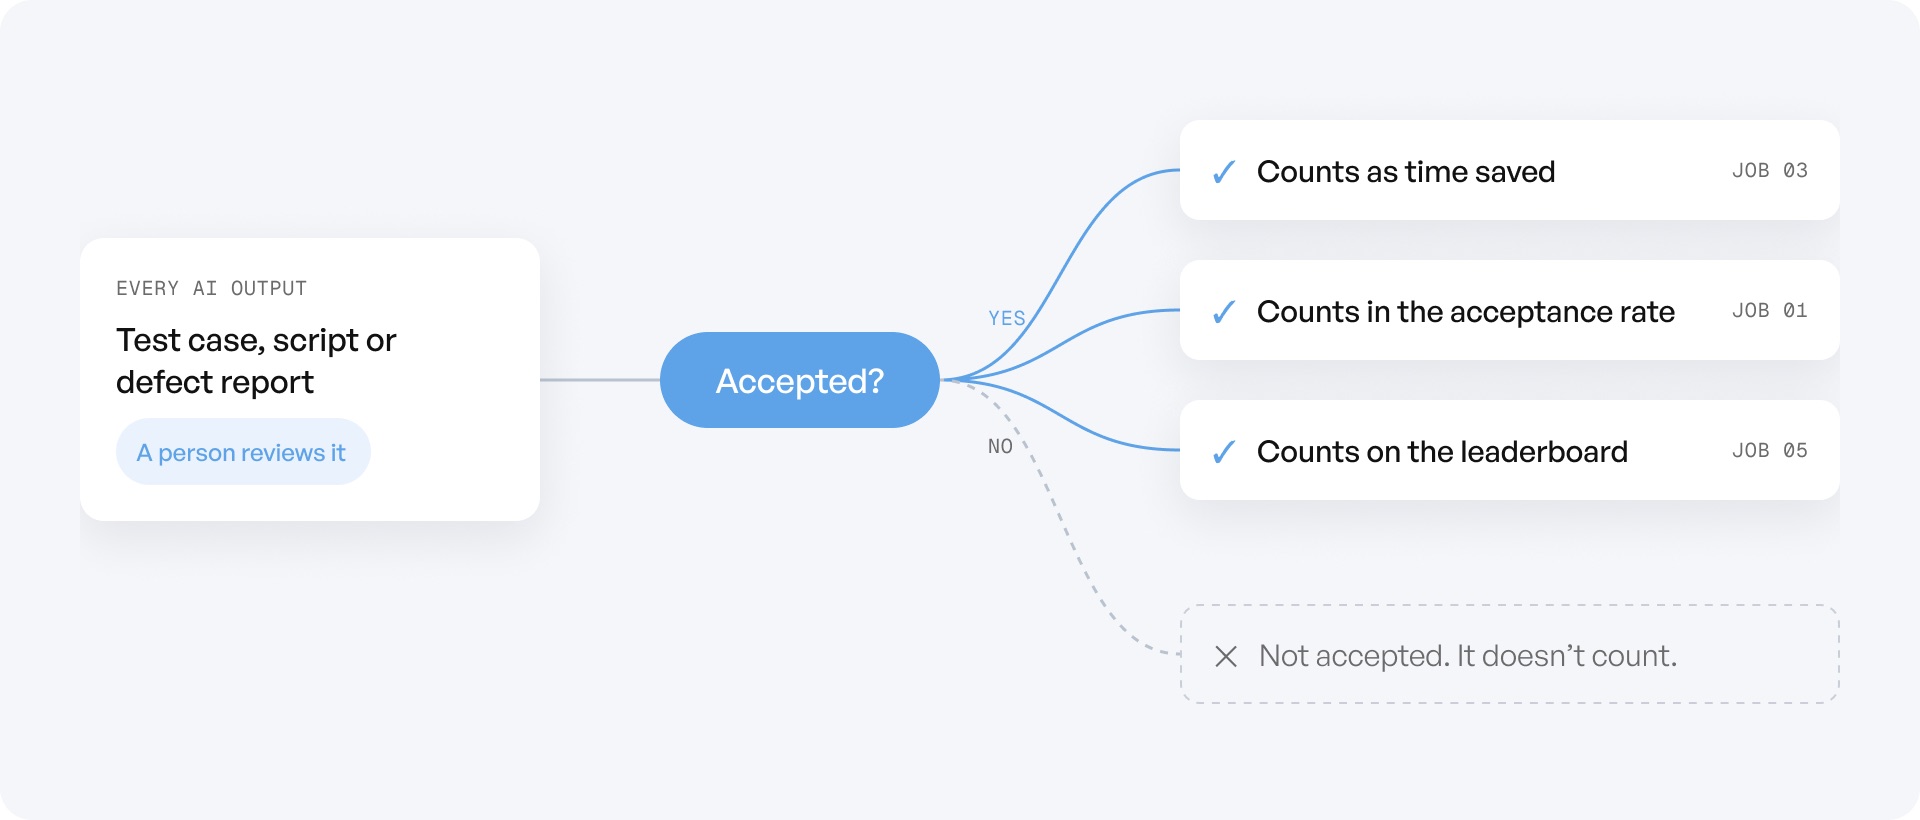
QMentis runs in steps, and at every step a person reviews what the AI made. That review is the most honest signal there is. If people accept the AI’s work, it’s working, no matter how many times they ran it.
So I built the dashboard on one chain. Wherever the numbers drop off, that’s where the ops lead steps in.
The solution
We imagined one week for the ops lead. It’s Friday, the whole week’s data is in, and they open QMentis to find out if anyone needs them.
Solution #1 Central operations dashboard
See it: a bird’s-eye view of every team
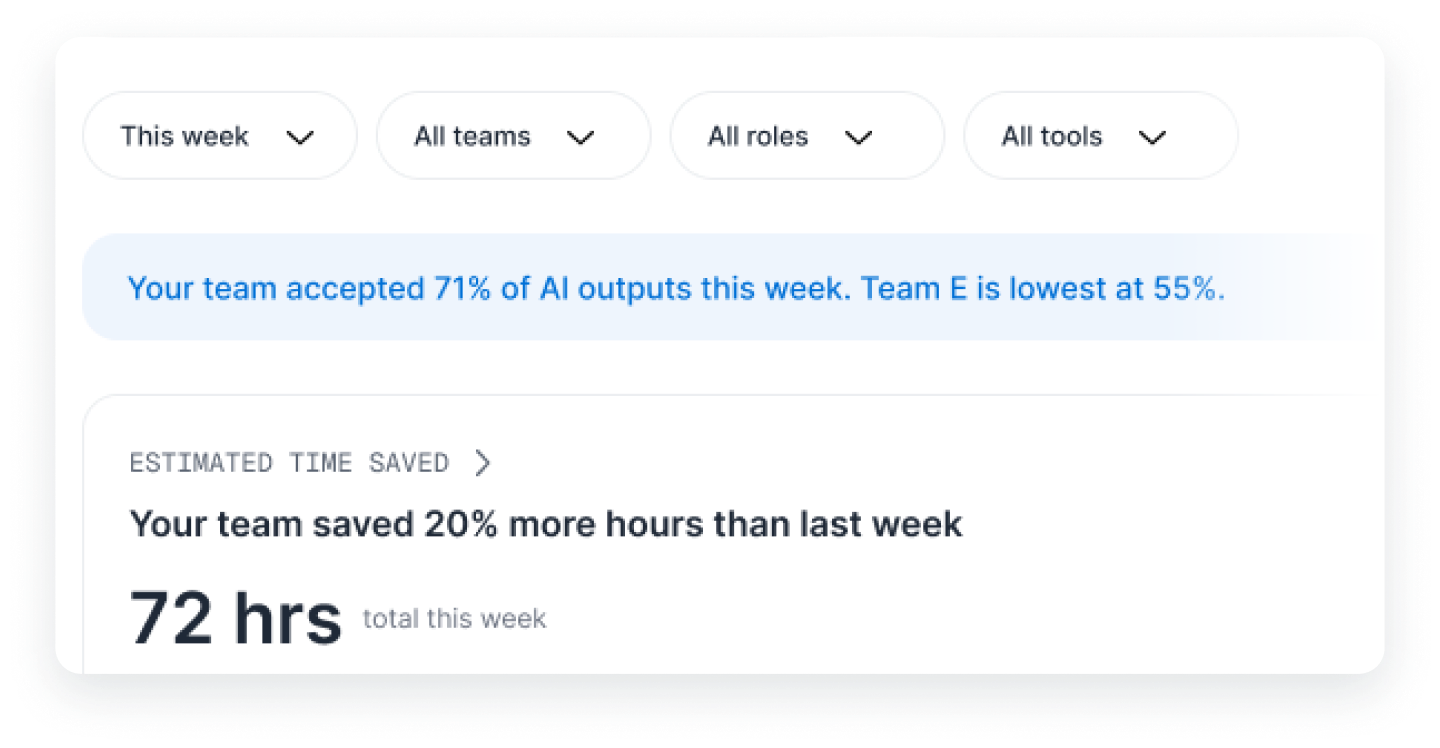
The dashboard opens on one sentence: Your team accepted 71% of AI outputs. Team E is lowest at 55%. Below it are time saved, which team uses which tool, activity, tokens and who’s leading.
Solution #2 Teams & projects
Compare it: every team side by side
On Teams, every team sits side by side: active people, outputs accepted, tool mix, hours saved and share of tokens. Team A is strong across every tool. Team E barely uses Risk Assessment.
Solution #3 Users
Act on it: move the right person
On Users, they open Anna. She leads Team A on Risk Assessment, exactly the tool Team E struggles with. Team A keeps two strong people after she moves, so nobody loses.
Design decision #1
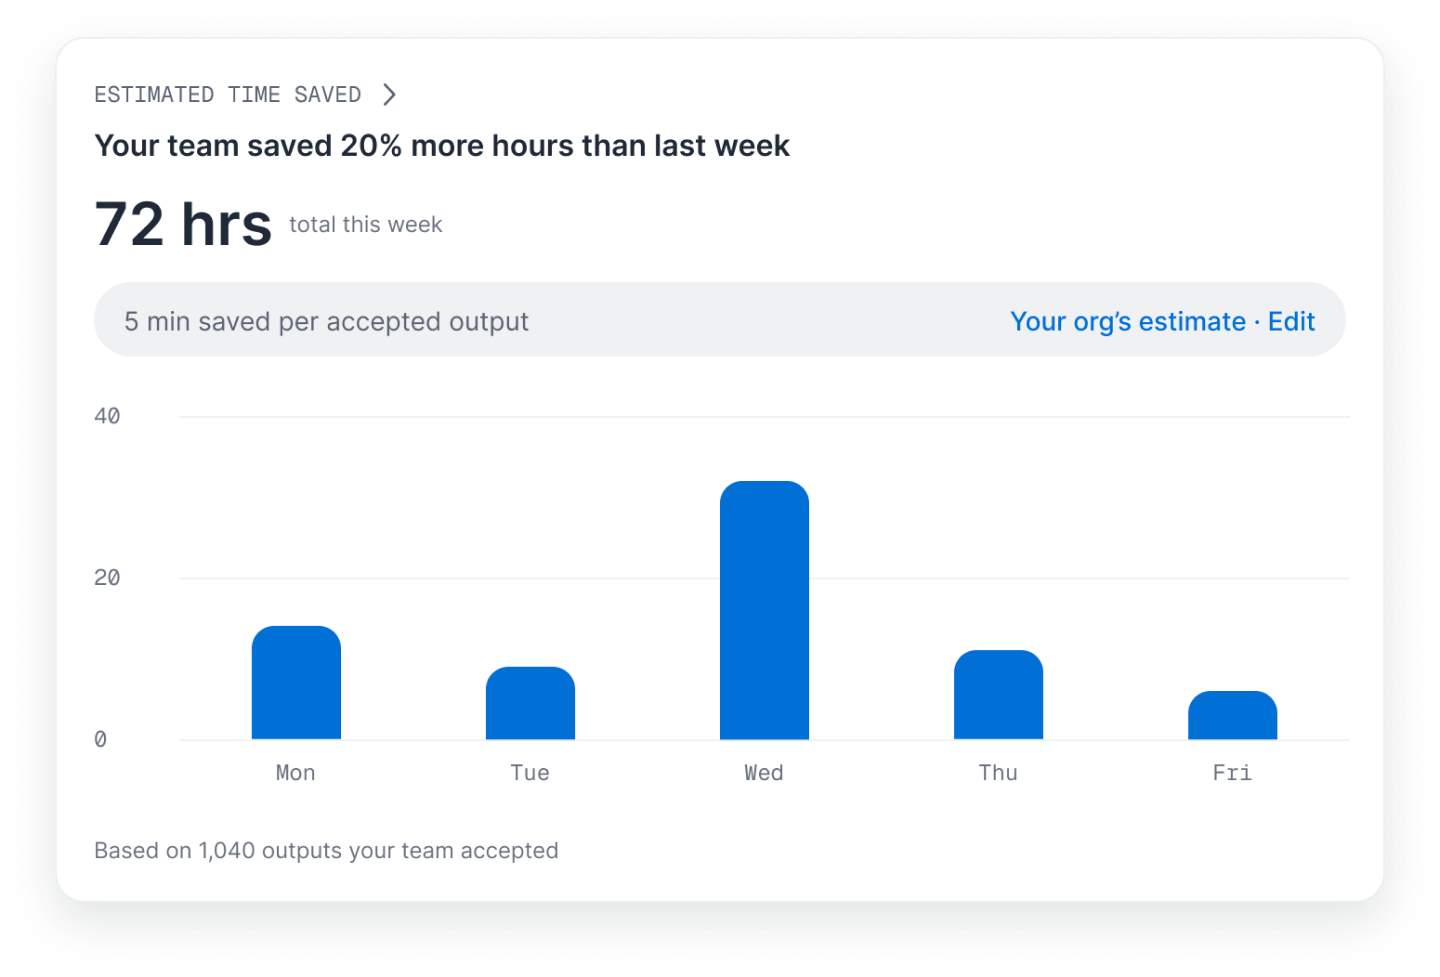
Time saved only counts accepted work
A number you can’t explain is a number leadership won’t trust.
Design decision #2
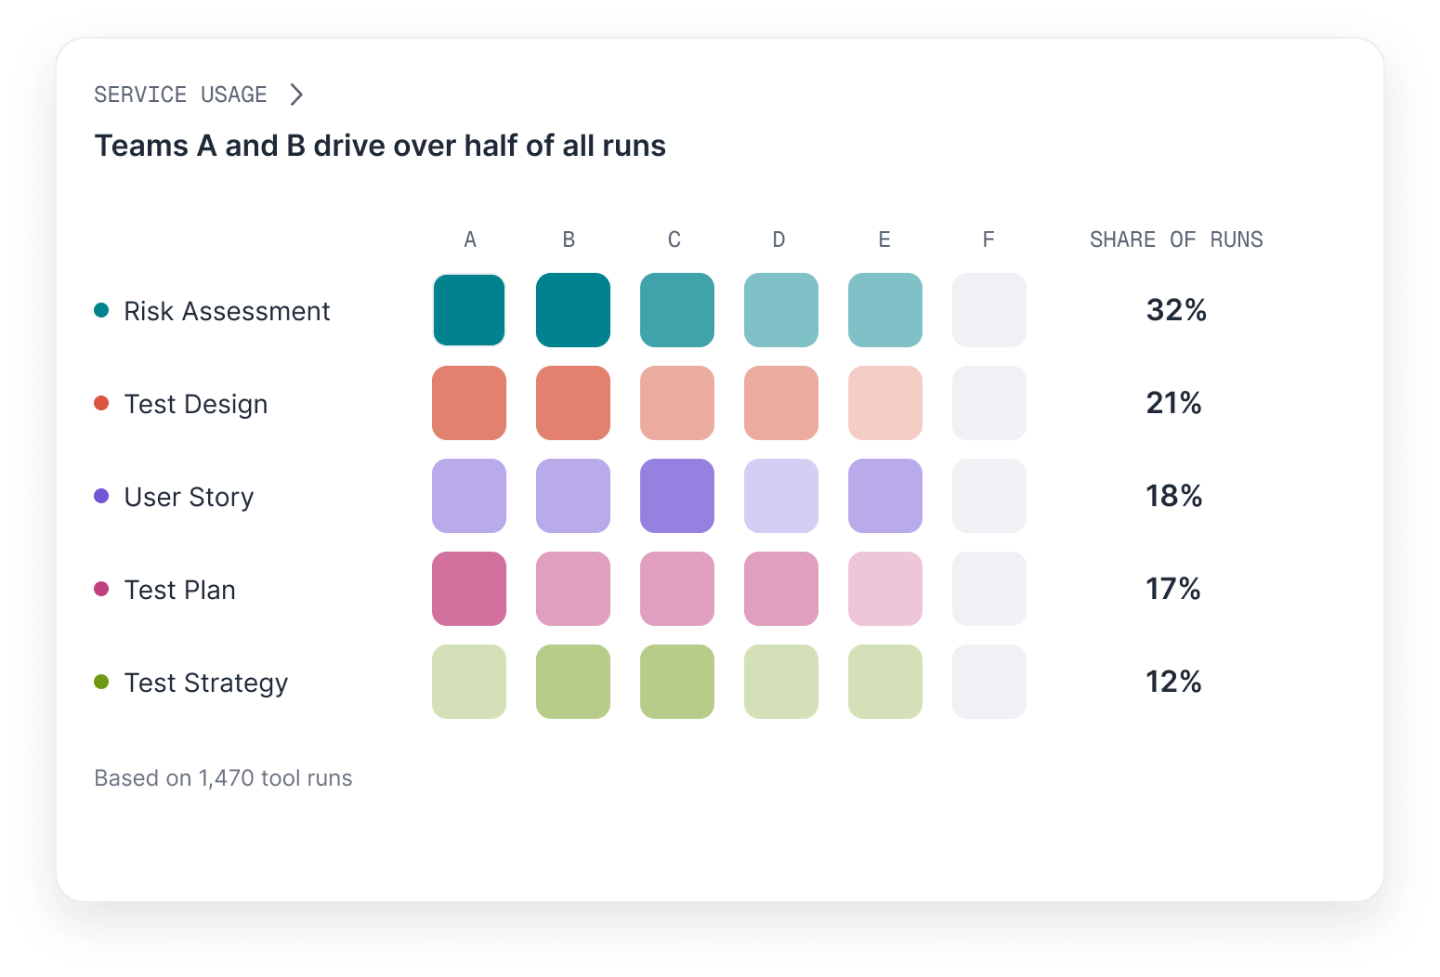
A grid, not a pie
A pie tells you which tool is popular. The ops lead needs to know which team isn’t using it.
Design decision #3
Every title is the takeaway
Card titles say what the chart means, not what it is.
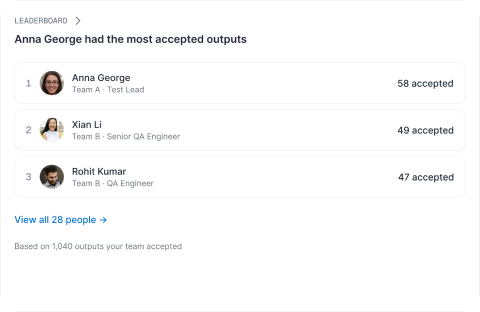
AlsoThe leaderboard came from the stakeholders, who wanted to recognise people doing well. I ranked it by accepted outputs, so it rewards good work, not busy work.
Edge cases
When the week doesn’t go to plan
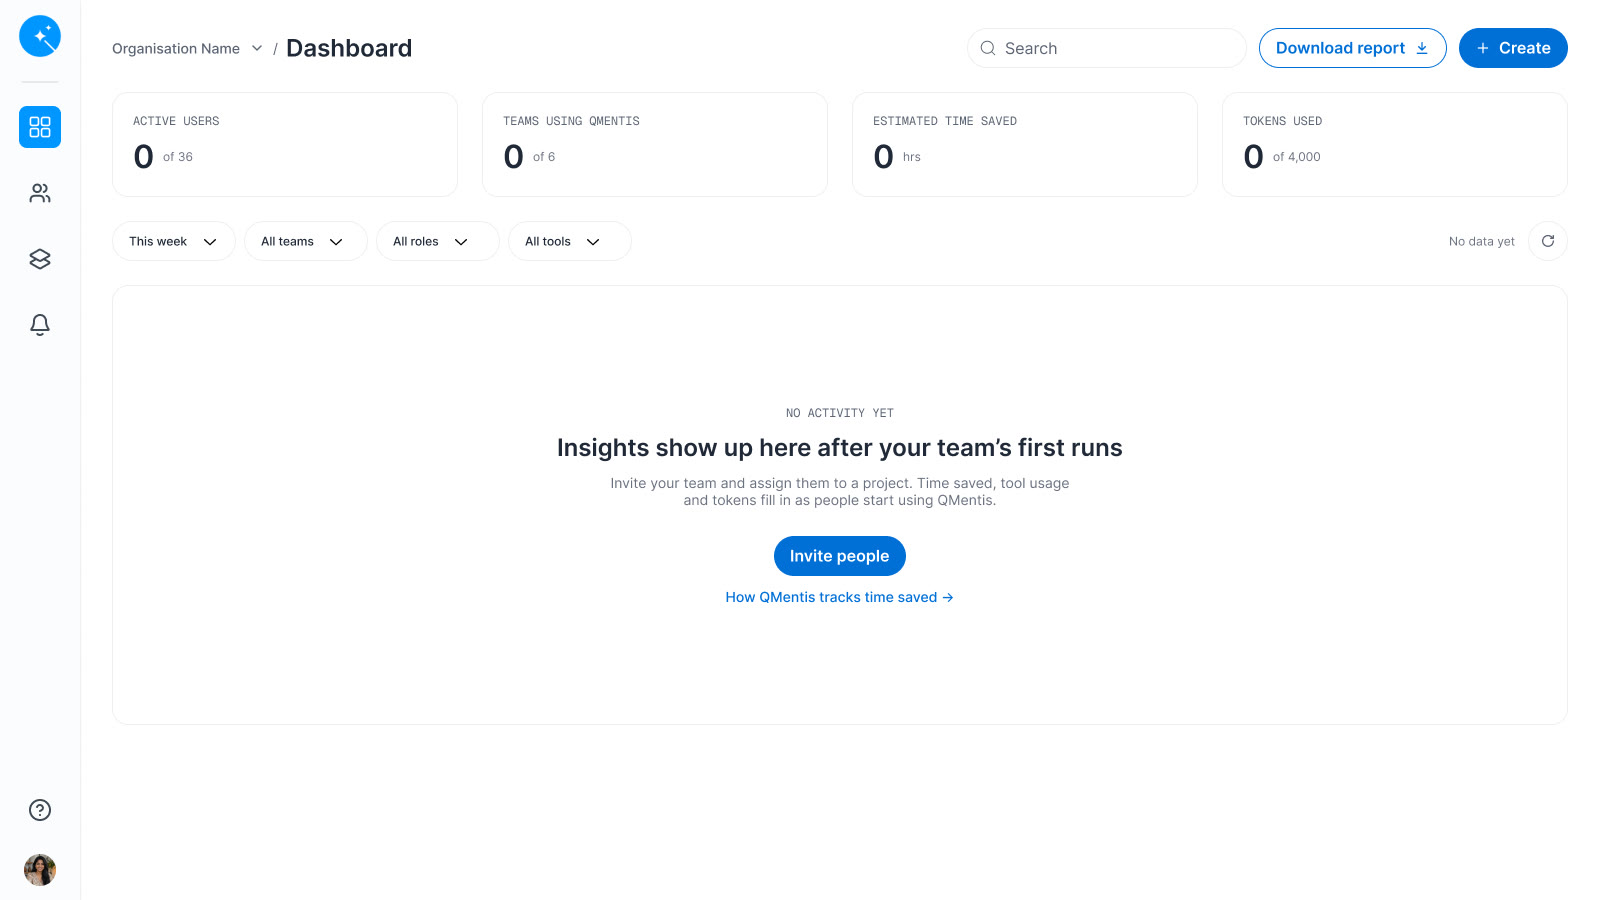
Here’s how I dealt with edge cases, at a glance.
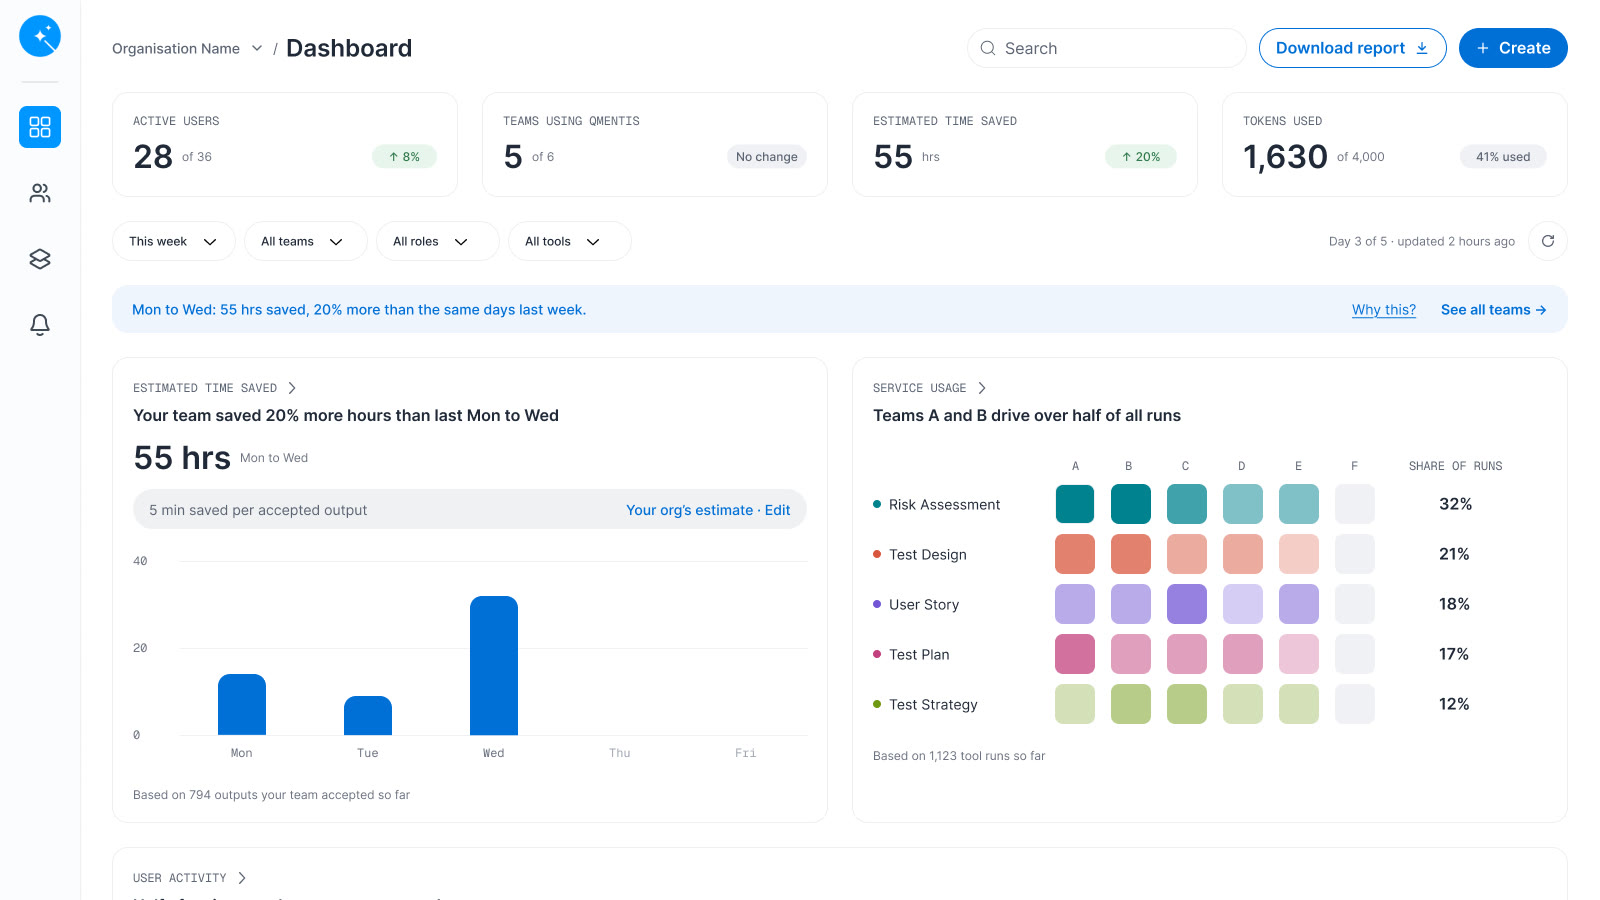
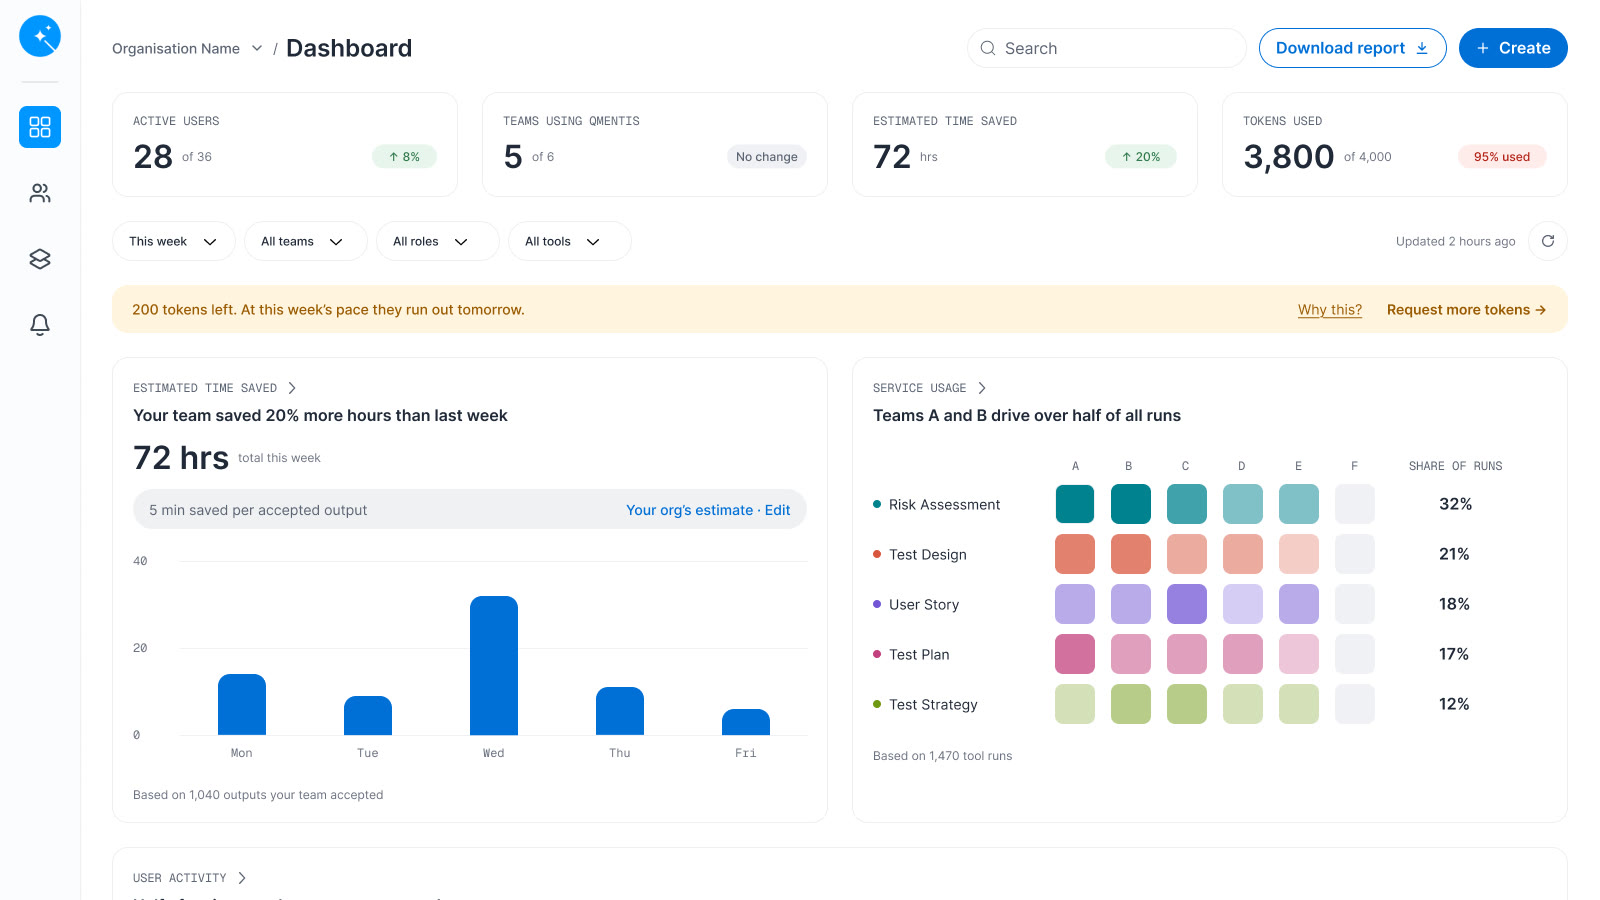
It’s Wednesday. Thursday and Friday stay empty and the copy says “Mon to Wed”, so half a week doesn’t look like a drop.
Learnings and reflections
Shipping the MVP
“Teams had a shared view of operations, less back-and-forth and more confidence in making decisions.”A QMentis user
We designed while engineering built, and requirements changed mid-sprint. Not everything could be perfect, but everything had to be intentional. So we planned the build in two tracks.
The MVP, built on the data we already had.
An accept, edit and reject quality page, an ROI card, and spend forecasts with alerts.
What I’m taking with me
- Every number needs a meaning.If no one can explain where a number comes from, leadership won’t trust it.
- Scope for the MVP, not the dream.Decide what the minimum lovable product needs, and what waits for version 2.
- Trust in AI is built with data.What people accepted, not how often they ran it, makes an AI tool believable.
- Surface the decision, not the data.The right information in the right place lets people act quickly.
- Tell a story through information.One sentence at the top, the evidence below it, the action next to it.